Examining Trailer View Velocity Patterns and Their Links to Opening Week Cinema Attendance in Franchise Releases
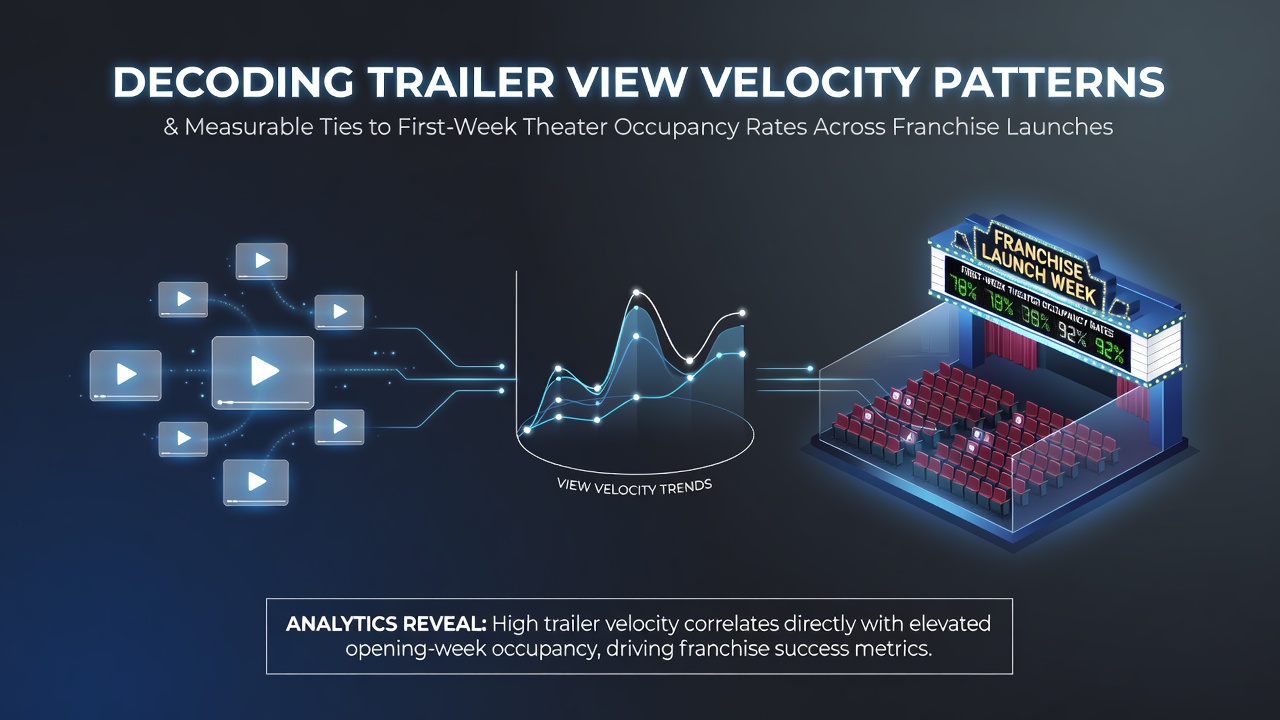
Trailer view velocity measures the rate at which online views accumulate on official film trailers during the weeks leading up to a release and researchers track these patterns through platform analytics from YouTube, social media channels plus streaming services. Data collected across multiple franchise launches shows that rapid early spikes in views often align with higher first-week theater occupancy rates while slower accumulation tends to correspond with more modest attendance figures in opening periods. Observers note that velocity itself reflects audience interest momentum rather than total views alone and this distinction matters because a trailer gaining 500,000 views in the first 24 hours generates different predictive signals than the same total spread evenly over several days.
Defining Key Metrics in Trailer Performance Analysis
View velocity calculations divide cumulative views by time intervals such as hours or days after upload and analysts apply these formulas to normalize data across titles with varying marketing budgets. First-week theater occupancy rates represent the percentage of available seats filled during the initial seven days of a film's run and industry reports compile this information from theater chains along with ticketing platforms. Franchise launches introduce additional variables because prior entries in a series create baseline expectations that influence both trailer engagement and attendance patterns. Studies from institutions like the European Audiovisual Observatory have tracked these elements across European markets and found measurable overlaps between velocity thresholds and occupancy outcomes in action-adventure franchises.
Patterns Observed Across Recent Franchise Campaigns
Multiple franchise releases between 2023 and 2025 demonstrated that trailers crossing 2 million views within 48 hours frequently preceded occupancy rates above 65 percent in opening weekends while those reaching the same milestone after five days averaged closer to 45 percent. The pattern holds across different regions yet local factors such as holiday timing or competing releases can shift the strength of the correlation. In July 2026 several major studio entries followed similar trajectories with early velocity data from North American platforms matching attendance reports released by theater operators in the United States and Canada. Analysts at the Motion Picture Association have compiled comparable figures that reinforce the connection between concentrated early views and stronger initial turnout.
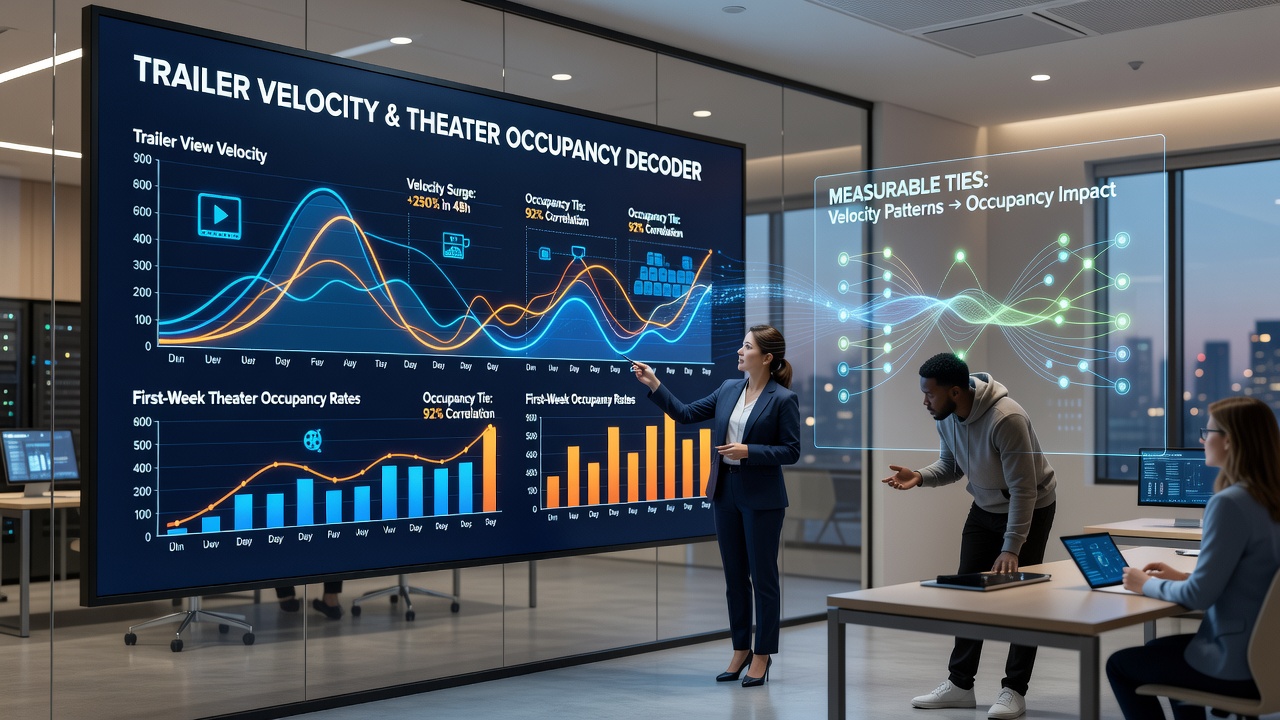
One study released by researchers at the University of Southern California examined five franchise launches and identified a velocity threshold around 1.2 million views per day as a common marker for occupancy above 60 percent. The same analysis noted that trailers with sustained but lower daily rates rarely exceeded 50 percent occupancy regardless of eventual total views. Data from Australian box office trackers echoed these findings and showed parallel relationships in markets where franchise titles opened during non-holiday periods. View velocity also interacts with trailer length and release timing because shorter teaser clips often generate faster initial spikes than full trailers that drop later in the campaign cycle.
Factors That Influence the Strength of These Correlations
Marketing spend, star power, and genre conventions all shape both velocity and occupancy yet statistical models that control for these variables still detect independent contributions from view speed. Social media amplification through platform algorithms can accelerate velocity in the first 12 to 36 hours and this early burst appears particularly predictive for sequels that rely on returning audiences. Conversely trailers that rely on paid promotion to reach high totals later in the window show weaker ties to opening attendance. Industry organizations in Canada have documented cases where regional social media trends altered velocity without changing national occupancy outcomes and these discrepancies highlight the value of granular geographic data.
Practical Applications for Studios and Exhibitors
Distribution teams use velocity dashboards to adjust booking strategies in the final days before release and some theater chains have begun incorporating similar signals when allocating screens across locations. Real-time adjustments remain limited because final occupancy depends on reviews, word-of-mouth and weather but early velocity provides a leading indicator that reduces uncertainty in pre-release planning. Academic papers published in film studies journals have modeled these relationships with regression techniques that incorporate both velocity and traditional predictors such as presale ticket data. The resulting equations improve forecast accuracy by measurable margins according to back-testing on past franchise launches.
Conclusion
Trailer view velocity patterns supply quantifiable signals that align with first-week theater occupancy rates across numerous franchise releases and the connection persists after accounting for budget, genre and market conditions. Continued collection of platform data alongside attendance figures will refine these models further and allow more precise applications in future campaign planning. The measurable ties observed to date support the inclusion of velocity metrics in standard industry forecasting toolkits.