How Local Preferences Drive Shifts in National Movie Rankings
Regional audience preferences shape national film rankings in measurable ways each year, with data from ticket sales and streaming metrics showing consistent patterns across different parts of the country. Observers note that while nationwide charts reflect aggregate performance, underlying regional differences in genre appeal, star power, and storytelling style often determine which titles climb higher on those lists and sustain longer runs at the box office.
Film distributors track these variations closely because adjustments in marketing spend and release timing can amplify or dampen a movie's trajectory once early regional results come in. Researchers have documented how a strong opening in one geographic cluster frequently creates momentum that lifts the title in subsequent weeks across broader markets.
Patterns in Genre Popularity by Region
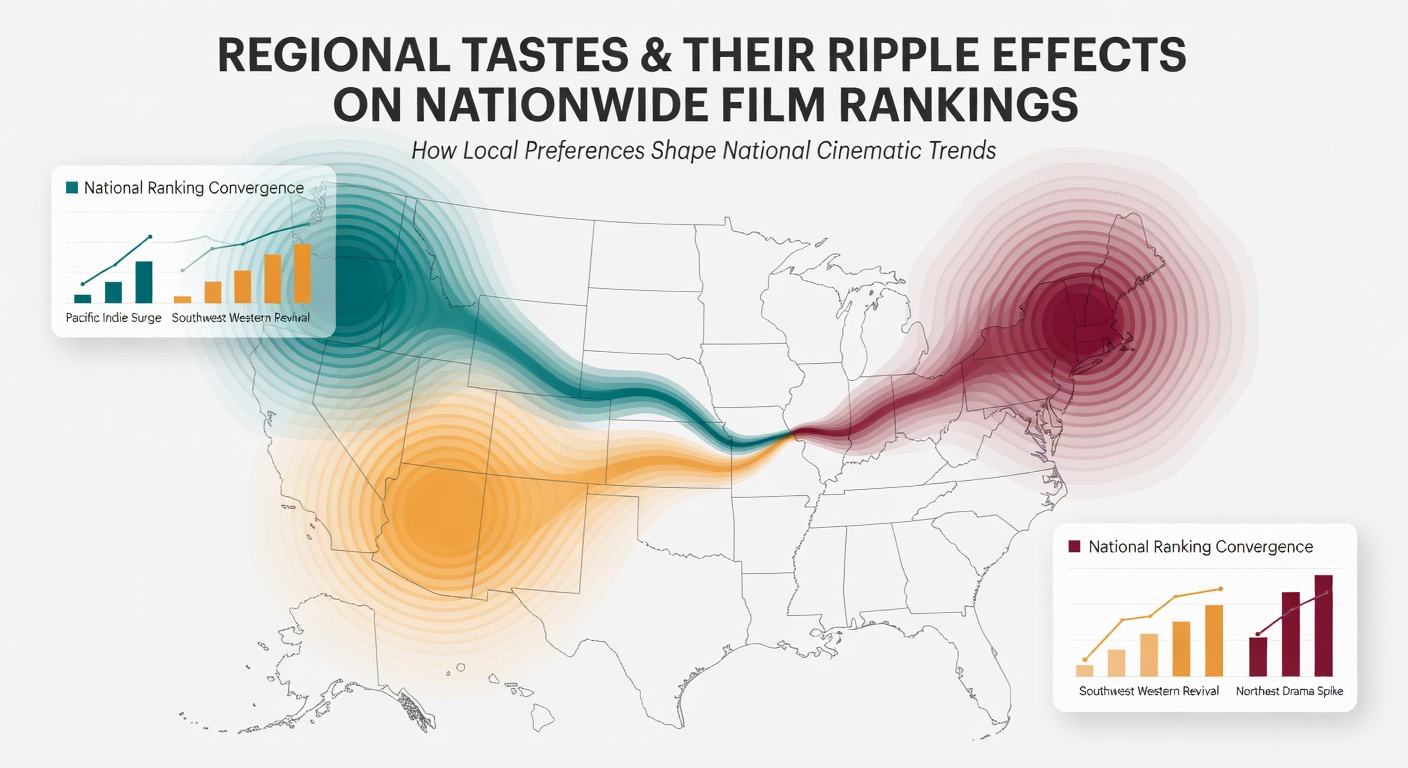
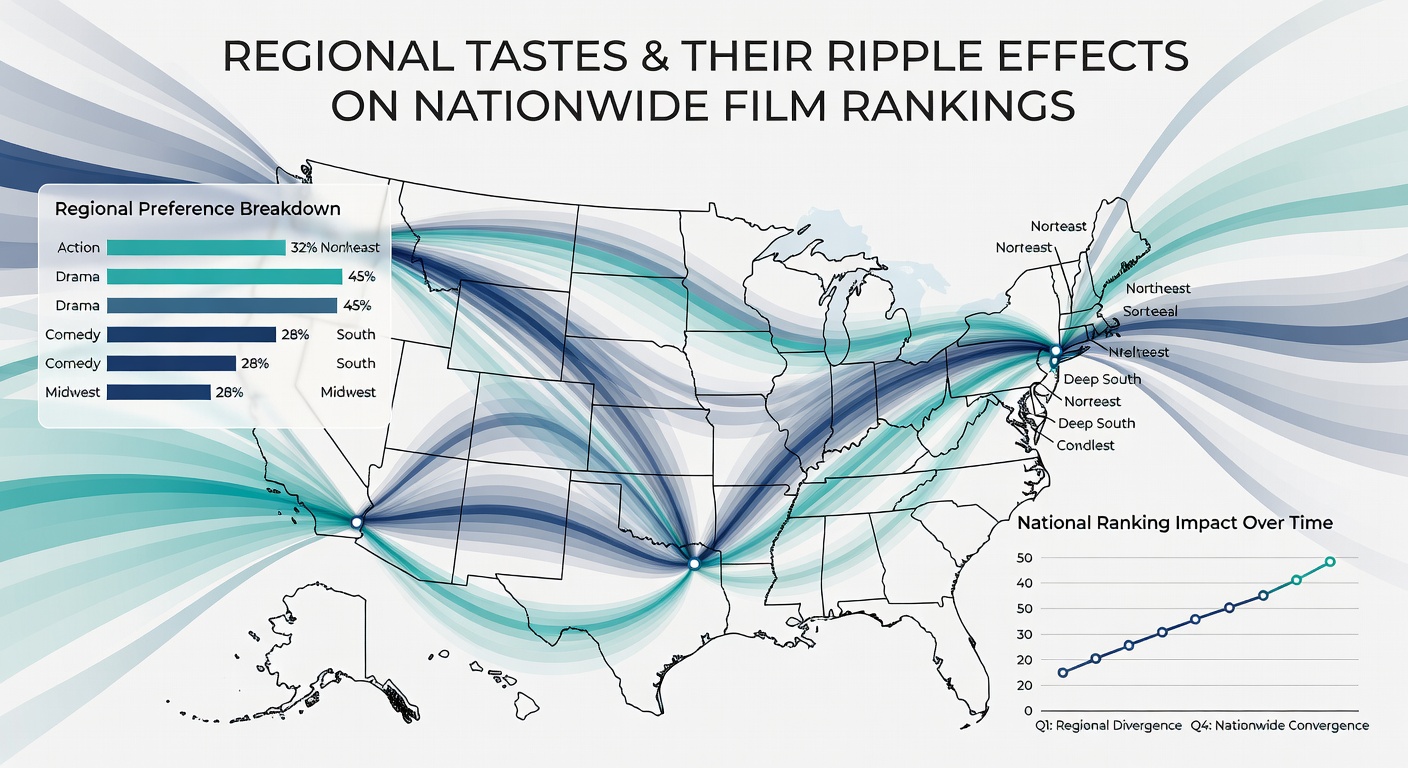
Action films tend to draw larger crowds in southern and midwestern states according to historical box office breakdowns, whereas dramas and independent titles often post stronger per-screen averages along the coasts and in urban centers. These divides appear in weekly reports compiled by tracking services that segment sales data by designated market areas. One study from a university film economics program revealed that horror releases generate disproportionate ticket sales in specific Midwest zones compared with national averages, pushing certain titles into higher national positions than their initial marketing projections suggested.
Comedy releases show parallel regional skews, with stand-up driven vehicles performing better in areas where live comedy circuits maintain strong followings. Data indicates that animated family features maintain more uniform appeal nationwide, yet even these films register noticeable upticks in regions with higher concentrations of households that include young children. The resulting variations feed directly into the final placement on aggregated charts.
Case Examples of Regional Momentum Creating National Movement
Take one independent drama that opened modestly on a limited number of screens in Northeast markets during spring 2025. Strong word-of-mouth in those initial cities expanded the release footprint and lifted the film into the top fifteen nationwide within four weeks. Similar patterns emerged with a science-fiction title that tested well in western states known for tech industry audiences before crossing over to wider release. Those early regional spikes altered distributor strategies, including additional advertising buys and extended theatrical windows that ultimately improved the movie's final national ranking.
Another example involves a musical that drew outsized crowds in southern markets during its first month. The performance data prompted exhibitors in adjacent territories to increase screen counts, creating a ripple that carried the film higher on the national chart than comparable releases achieved in prior years. Industry reports confirm these regional-to-national pathways occur repeatedly across different genres and release scales.
Measurement Tools and Data Sources
Tracking services break down daily and weekly grosses by region, allowing analysts to isolate the contribution of each market to the national total. Figures from the Motion Picture Association illustrate how certain titles achieve elevated rankings primarily through concentrated strength in three or four key regions rather than uniform performance everywhere. Researchers at academic institutions have cross-referenced these numbers with demographic and cultural indicators to identify predictors of regional success.
International comparisons add further context. Reports issued by Screen Australia highlight parallel dynamics in that country, where state-level preferences influence national charts in ways that mirror U.S. patterns. Observers note that these measurement frameworks help studios forecast how regional tastes may shift overall rankings when planning release calendars.
Distribution Adjustments and Marketing Responses
Once regional data surfaces, studios frequently recalibrate campaigns to emphasize elements that resonate in high-performing areas. Trailer edits, social media targeting, and even cast appearances get tailored accordingly. These tactics extend a film's visibility and can elevate its position on nationwide lists for additional weeks. Exhibitors also respond by reallocating screens away from underperforming titles toward those showing regional strength, further accelerating the ripple effect on aggregate rankings.
Streaming platforms apply similar logic when deciding promotion priorities. Viewership metrics segmented by ZIP code reveal the same geographic clustering observed in theatrical data, prompting algorithmic adjustments that surface regionally favored content to wider audiences. The combined impact of these practices appears in year-end summaries that rank titles according to total earnings or views.
Trends Leading Into Mid-2026
Early 2026 release schedules already reflect heightened attention to regional testing markets. Several studios have announced plans to open select titles in test cities during April and May before wider expansion, citing improved forecasting accuracy from prior cycles. Data gathered during those windows will likely determine which films occupy top spots on national charts by late spring. Analysts expect continued emphasis on localized marketing as competition for audience attention intensifies across both theatrical and streaming windows.
Conclusion
Regional tastes operate as a primary driver behind shifts in national film rankings, with measurable data confirming their consistent influence across genres and release types. Distribution strategies, marketing refinements, and exhibition decisions all respond to these localized signals, producing the final nationwide order that appears on weekly charts. As measurement tools grow more granular, the connection between specific markets and broader performance rankings becomes increasingly precise and actionable for industry participants.