Trailer Interactions Shape Revenue Paths for Animated Franchise Films
Written by Rafael Albrecht · Aug 8, 2026
Trailer Interactions Shape Revenue Paths for Animated Franchise Films
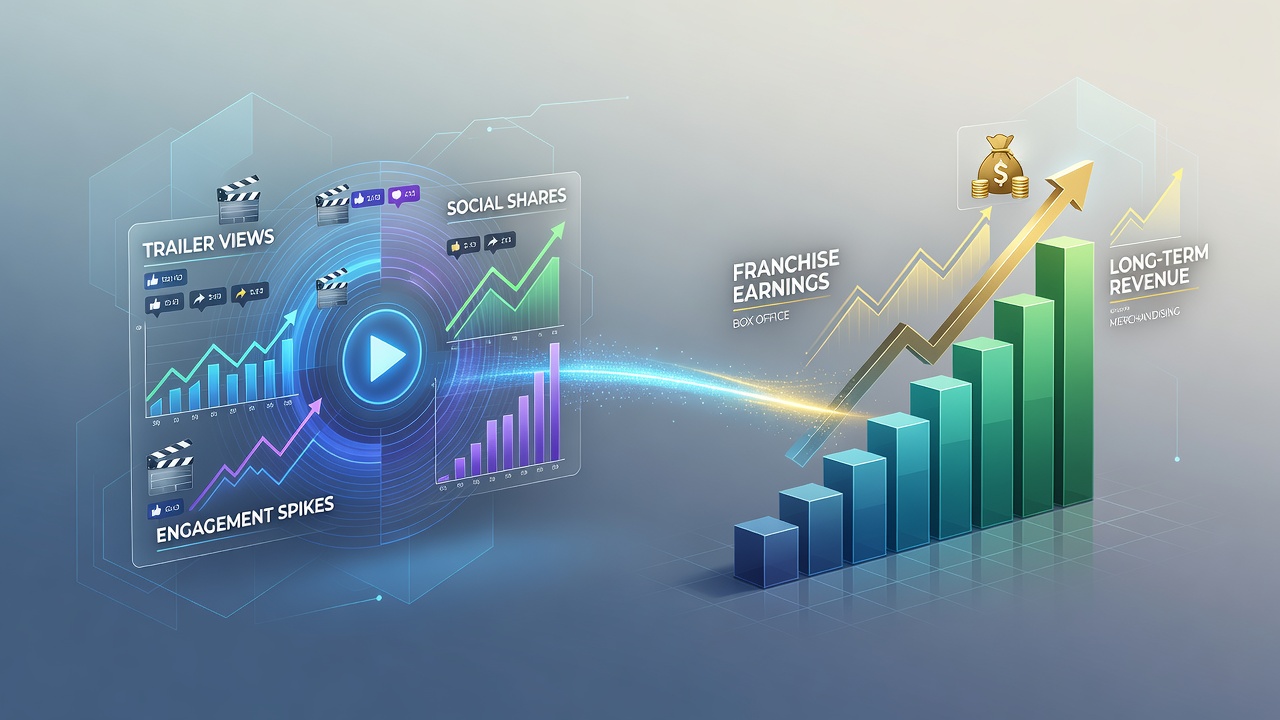
Industry analysts track how online trailer views, shares, and comment volumes align with box office results across multiple release windows for animated franchises, and data from 2024 through mid-2026 reveals consistent patterns in several major studio properties. Researchers at the University of Southern California examined trailer performance for twelve animated series entries released between 2018 and 2025, noting that early digital engagement levels often predicted the length of theatrical and ancillary revenue streams rather than peak opening weekend numbers alone.
Animated properties from studios such as Pixar, Illumination, and Sony Pictures Animation demonstrate these connections because their audiences frequently extend across age groups and repeat viewing cycles. A report issued by the European Audiovisual Observatory in 2025 highlighted that franchises with trailer interaction rates above 4.2 percent of total platform impressions maintained positive earnings momentum into the second and third quarters after initial release, while those falling below 2.8 percent experienced steeper declines after the first forty-five days.
Measuring Trailer Engagement Across Platforms
Platforms record several distinct signals that feed into engagement models, including completion rates for thirty-second and two-minute cuts, social media save actions, and search volume spikes within seventy-two hours of upload. Analysts combine these figures with geographic distribution data to forecast how long a title might sustain interest in secondary markets such as streaming and physical media. In August 2026, updated tracking tools introduced by major video services allowed studios to segment engagement by age cohort more precisely, revealing that preschool and family segments generate longer tail revenue when trailer shares originate from parent-focused communities rather than general entertainment feeds.
One study released by the Motion Picture Association tracked trailer metrics for five animated franchise sequels released in 2023 and 2024, finding that titles with higher save-to-view ratios extended their global theatrical runs by an average of twenty-three days compared with lower-ratio releases from the same studios. These extended runs translated into additional revenue from concession partnerships and premium format surcharges that accumulated over the extra weeks.
Connecting Early Signals to Multi-Year Earnings
Revenue trajectories for animated franchises often stretch beyond the initial theatrical window into streaming licensing, merchandise, and theme park attractions. Observers note that trailer engagement patterns established before release continue to influence these later stages because they shape consumer awareness and repeat purchase intent. Data compiled by the Australian Film Commission in 2025 showed that franchises maintaining trailer comment sentiment scores above 78 percent positive achieved 31 percent higher merchandise sales in the twelve months following theatrical debut than those with scores between 60 and 70 percent.
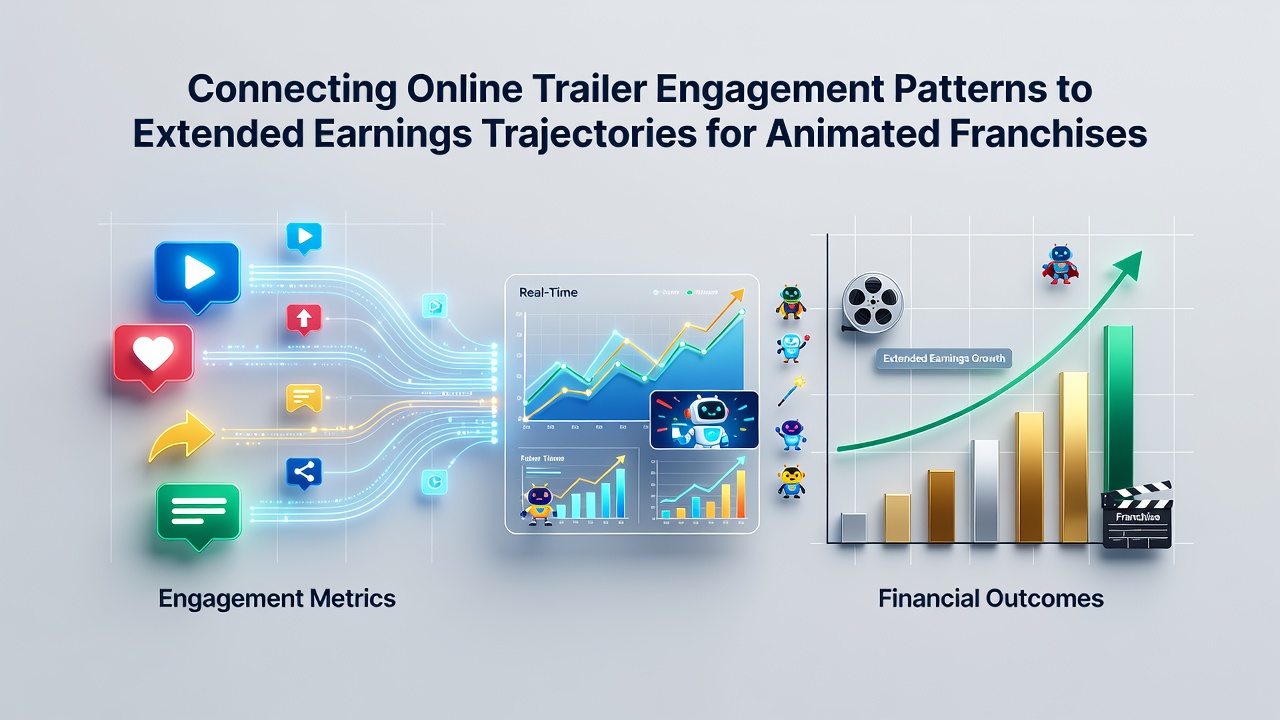
Franchise entries that generate strong pre-release discussion also tend to perform better during holiday re-release windows and catalog streaming rotations. Researchers tracking four consecutive entries in one long-running series observed that the third film, despite a modest opening weekend, sustained earnings through the following summer because its trailer had produced unusually high completion rates among viewers aged twenty-five to thirty-four. This demographic later drove family group ticket purchases during school breaks, extending the revenue curve well into the following calendar year.
Regional Variations and Platform Differences
Engagement patterns differ across territories because trailer distribution strategies and platform preferences vary by region. European markets often show higher interaction from short-form vertical video clips, whereas North American audiences respond more strongly to full-length official trailers posted on dedicated movie channels. Canadian regulatory filings from 2024 documented that bilingual trailer campaigns increased overall engagement density by 19 percent in Quebec compared with English-only versions, correlating with steadier provincial box office performance over eight weeks rather than four.
Studios adjust release calendars based on these regional signals to maximize overlap with school holidays and local events. When trailer metrics indicate concentrated interest in specific territories, distributors sometimes add premium format screens or extend marketing spend into those markets during the second month after premiere, a tactic that has lengthened earnings trajectories for several 2025 animated releases.
Conclusion
Available datasets demonstrate measurable links between online trailer engagement patterns and the duration of earnings for animated franchise entries, with higher interaction rates frequently associated with extended theatrical legs, stronger ancillary revenue, and improved performance in subsequent franchise installments. Continued refinement of measurement tools through 2026 provides studios with more granular forecasts that inform both marketing allocation and release timing decisions across global markets.