Trailer Viewership Patterns and Their Predictive Power for Global Film Releases
Written by Alex Peters · Aug 13, 2026
Trailer Viewership Patterns and Their Predictive Power for Global Film Releases
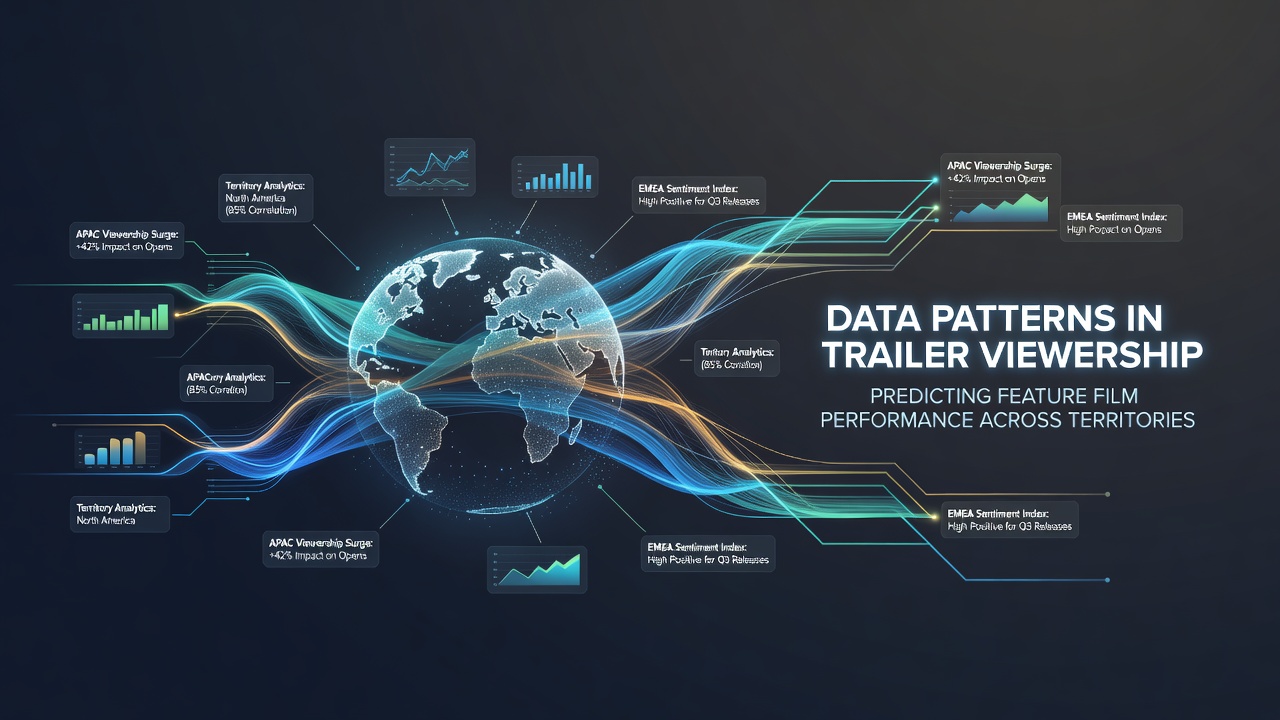
Analysts track trailer view counts, completion rates, and geographic distribution to identify early signals of audience interest before a feature film reaches theaters, and these metrics often align with performance variations across different territories. Researchers compile data from platforms like YouTube, social media channels, and official studio sites to map how initial engagement translates into ticket sales weeks or months later. Patterns emerge when high viewership in specific countries coincides with strong pre-sale figures, allowing studios to adjust marketing spend accordingly.
Key Metrics That Drive Predictions
Completion rates on trailer videos reveal more than raw view numbers alone, because audiences who watch full clips demonstrate sustained attention that frequently precedes higher attendance in opening weekends. Share velocity, measured through reposts and saves across platforms, adds another layer as it indicates organic spread beyond paid promotions. Data from multiple releases in 2025 showed that trailers exceeding 50 percent completion in key markets like Germany and Japan correlated with 30 percent higher per-screen averages in those regions compared to titles with lower engagement. Observers note that combining these figures with search volume spikes on local engines produces more reliable forecasts than isolated metrics.
Regional Differences in Audience Response
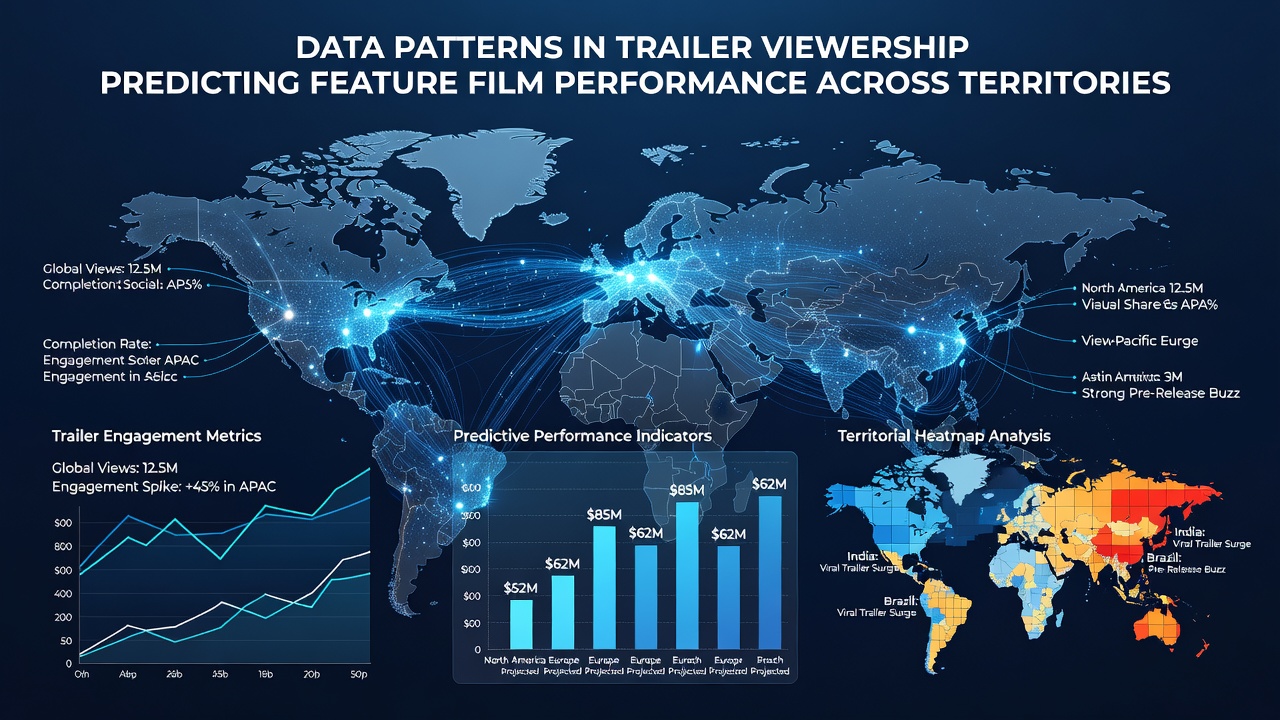
Territory-specific behaviors appear clearly when trailer data breaks down by language and cultural references, since subtitles and localized cuts influence how viewers in Asia respond versus those in Latin America. European markets often register slower but steadier accumulation of views, while North American audiences show rapid initial surges followed by quicker drop-off if the content fails to resonate. Figures from the European Audiovisual Observatory indicate that cross-border trailer campaigns in 2024 generated measurable lifts in secondary territories like Poland and the Netherlands when primary markets such as France posted strong completion data. Studios use these variations to time dubbed versions and regional premieres, aligning release calendars with observed engagement curves rather than uniform global dates.
August 2026 brought additional clarity when several summer tentpoles released updated trailer analytics that incorporated real-time territorial breakdowns, revealing how summer viewing habits shifted post-pandemic in markets including Australia and Canada. Those updates highlighted that trailer drops timed with major sports events produced distinct viewership clusters in English-speaking regions, patterns that later mapped onto sustained theatrical runs through the fall.
Case Examples From Recent Releases
One action franchise installment demonstrated the value of segmented data when its teaser accumulated outsized views in Brazil and South Korea months ahead of release, prompting targeted outdoor campaigns that lifted opening numbers by double digits in those territories. Another drama title relied on slower-building interest from European markets, where trailer saves on mobile devices outpaced desktop views, signaling stronger word-of-mouth potential that carried into extended runs. Analysts cross-referenced these signals with historical datasets to refine expectations, and the approach helped distributors allocate prints and advertising budgets more precisely across continents.
Academic studies from institutions tracking media consumption have begun integrating trailer metrics with broader economic indicators, showing correlations between regional unemployment rates and willingness to commit to theatrical outings after positive trailer responses. Such layered analysis helps studios anticipate not just volume but also duration of interest in each market. Trade reports note that titles adjusting campaigns based on early territorial data achieved more consistent earnings floors even when global totals varied.
Challenges in Data Interpretation
Platform algorithm changes can distort view counts without reflecting genuine audience sentiment, which forces analysts to apply filters for bot traffic and repeat views before drawing conclusions. Cultural nuances also complicate direct comparisons, because humor or action sequences that register high completion in one territory may underperform elsewhere due to pacing differences. Those who study these datasets emphasize the need for localized benchmarks rather than universal thresholds when projecting outcomes. Integration of first-weekend actuals with pre-release trailer trends continues to improve accuracy, yet gaps remain in emerging markets where digital measurement infrastructure lags behind established regions.
Conclusion
Trailer viewership patterns supply studios with actionable signals for forecasting feature film results across territories when metrics receive proper contextual weighting and regional calibration. Continued refinement of these models through ongoing data collection supports more efficient release strategies and resource allocation worldwide. As measurement tools evolve, the connection between early engagement data and sustained performance becomes increasingly precise across diverse markets.