Viewer Retention Patterns in Franchise Sequels Across Domestic and International Markets
Written by Iris Hughes · Jun 20, 2026
Viewer Retention Patterns in Franchise Sequels Across Domestic and International Markets
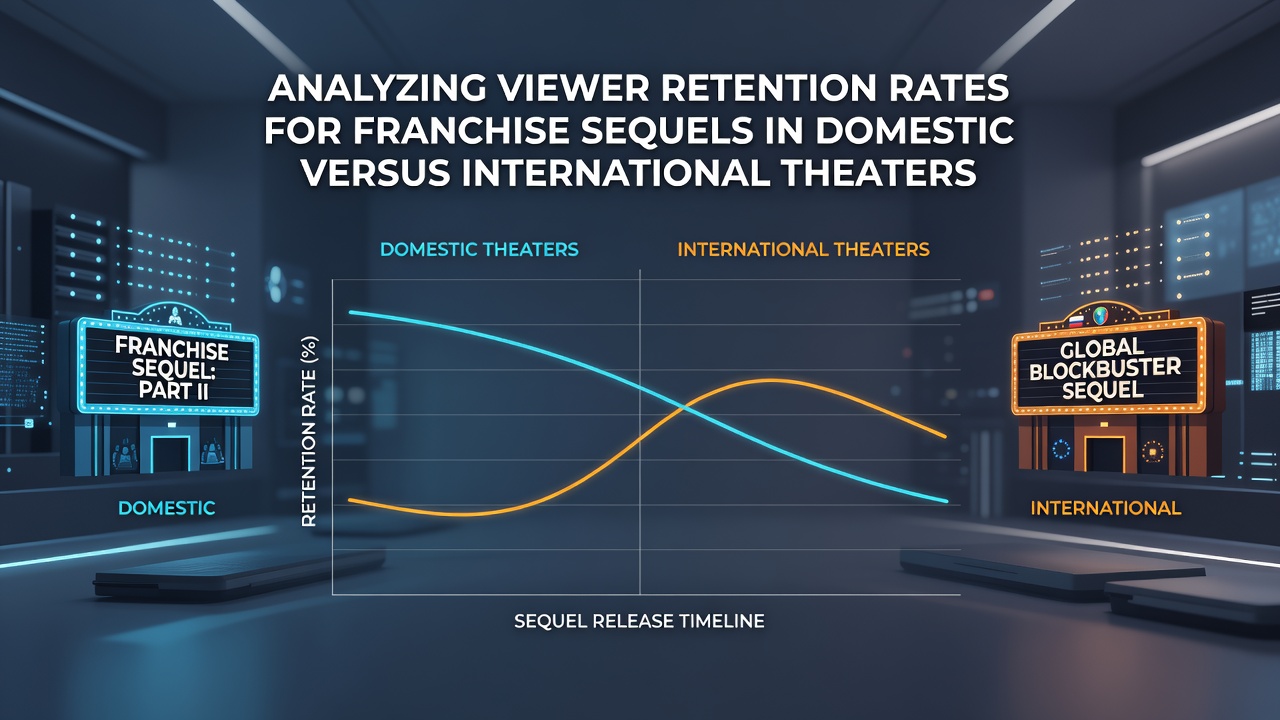
Viewer retention rates for franchise sequels reveal distinct patterns when analysts compare domestic theaters to international ones, and data collected through 2025 shows how these differences shape release strategies worldwide. Studios track metrics such as week-to-week ticket sales, repeat viewings, and audience drop-off percentages to measure how well a sequel holds interest after its opening weekend.
Key Metrics in Retention Analysis
Industry reports define retention through several indicators including second-weekend box office performance relative to the debut, total run length in theaters, and per-screen averages that decline over time. According to figures released by the Motion Picture Association, domestic markets often post steeper initial drops for sequels while international territories demonstrate steadier holds in many cases. Researchers compile these numbers from theater chains and distributors to build comparative models across regions.
Franchise titles released in June 2026 provide fresh datasets for this analysis because multiple major sequels opened simultaneously in both domestic and international circuits. Observers note that early tracking for those releases already indicates variances in how long films remain in top screens before moving to smaller auditoriums or exiting altogether.
Domestic Market Trends
Domestic audiences frequently deliver strong opening weekends for established franchises yet show quicker fatigue in subsequent weeks. Data compiled by theater analytics firms indicates that U.S. and Canadian runs for sequels average a 45 to 55 percent drop from first to second weekend, a pattern tied to heavy marketing saturation and competition from new releases. Those who've examined multiplex schedules find that domestic chains rotate titles more rapidly, which shortens the window for sustained attendance.
Take one study that examined five consecutive entries in a popular superhero series where domestic retention fell below 40 percent by week three in four of the films. Analysts attribute this partly to higher ticket prices and broader entertainment options available to local viewers, factors that encourage selective rather than repeat attendance.
International Performance Comparisons
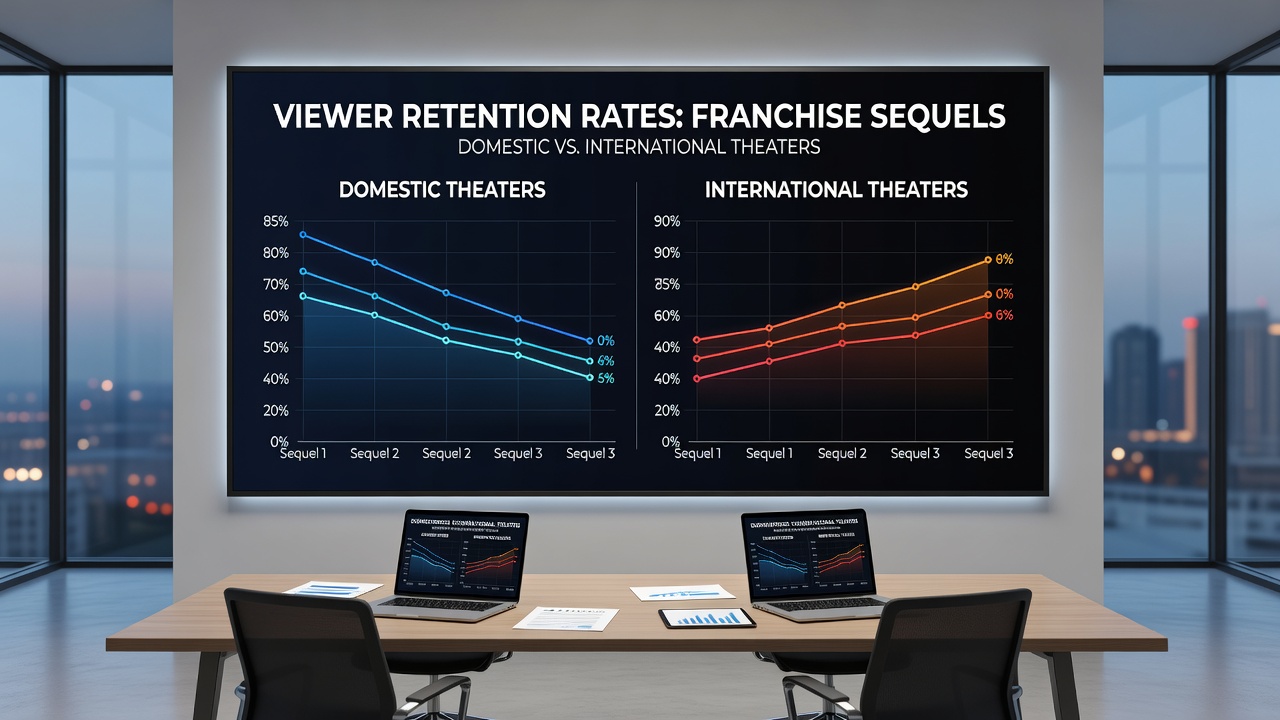
International markets present a contrasting picture because territories such as Europe, Asia, and Latin America often extend runs beyond domestic timelines. Research from the European Audiovisual Observatory highlights that sequel retention in those regions averages 10 to 20 percentage points higher in the second and third weeks compared with North American results. Distributors adjust release calendars to capitalize on staggered school holidays and local events that boost mid-run attendance.
What's notable is how cultural familiarity with long-running franchises influences these outcomes. In markets where dubbed or subtitled versions reach wider demographics, word-of-mouth sustains interest longer, leading to steadier per-screen averages through week four or five. Figures from Australian screen industry reports align with this trend, showing that certain action and adventure sequels maintained 60 percent or more of opening weekend earnings into their second frame when released during regional festival periods.
Factors Driving Regional Differences
Several elements contribute to the observed gaps. Marketing spend allocation plays a role because campaigns in domestic territories concentrate heavily upfront, while international efforts often phase additional promotions to support later weeks. Theater density also matters since many overseas locations operate fewer simultaneous wide releases, which reduces audience fragmentation.
Those who've studied distribution contracts note that revenue-sharing agreements sometimes incentivize longer international playtimes because exhibitors receive better terms after the initial period. This structure encourages chains to keep sequels on screens when domestic counterparts have already shifted focus to newer titles.
Case Examples from Recent Releases
One franchise sequel released in late 2025 demonstrated these dynamics clearly when domestic earnings fell 52 percent after opening while combined international figures dropped only 31 percent over the same interval. Similar patterns emerged in earlier entries where Latin American and Asian markets posted extended runs that offset faster domestic declines. Observers tracking June 2026 openings expect comparable results based on preliminary social media engagement data and advance ticket sales from those regions.
Conclusion
Retention rate analysis for franchise sequels continues to guide release timing and marketing emphasis as studios weigh domestic speed against international longevity. Data compiled through mid-2026 reinforces that geographic variations stem from structural market differences rather than content alone, and ongoing tracking will determine whether future sequels adopt more tailored regional strategies to maximize overall theatrical windows.